Broken Clocks are Right Twice a Day

Does anyone know when to get in and out of the market? Many professionals try, and we’ve heard a few theories from amateur investors lately. It’s tricky to tell fact from fiction. There are a million ways to analyze historical data to find timing patterns that appear to produce attractive returns. The real question you need to ask yourself: “Is there any reason why I should expect that pattern to continue in the future, or is it purely due to chance?”
An example. Over the last thirty years, if you sorted stocks based on the letter of the alphabet they started with, you would see that stocks that began with the letter “M” outperformed those that started with the letter “E.” Is there any reason to suspect this to continue over the next 30 years?
No, clearly, the letter of the alphabet should have no impact on a company’s returns. The reason for this difference is that Microsoft was a large, successful company over this period, while Enron was a large, unsuccessful company over this period.
When working with “noisy” data, the odds that the results are evenly distributed is very small. If you roll a die six times, the odds of getting each number exactly once is tiny (1.5%). That means there is a 98.5% chance you will roll some number two or more times and some number zero times.
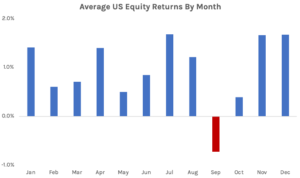
A typical market timing strategy we hear about around this time of year is to “avoid investing in the month of September.” At first thought, it seems odd that September would produce below-average returns, but when you look at the historical data, it is true!

Is there any economic rationale as to why this should continue in the future? I can’t think of any. Some claim that it is due to market participants selling positions to clean up their books after taking time off in the summer. If that were true, why wouldn’t investors try and get ahead of it and sell in August? Or why wouldn’t hedge funds gobble up all the low-priced stocks and keep prices stable?
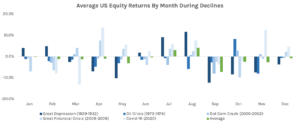
Let’s dive deeper into the data and look at the five largest market declines over the last 100 years. Each drop produced several months of negative returns, but all five of them spanned September at some point.

The recession peaked in different months every time, and every month was hit negatively at some point. However, there was bound to be one month affected more than others. It just happened to be September. From 1926 to 2021, 52% of the September months had positive returns. The large negative returns from a few market downturns have skewed the average to be negative. The question is, do we expect this to continue in the future?
Whenever you hear of these market timing strategies, you need to ask yourself if there is a logical economic rationale as to why the trend existed in the past and why it should continue in the future. Is there some risk associated with September we don’t know about? Is there some behavioral rationale that investors can’t arbitrage away? If you can’t come up with a concrete reason, whatever anomaly you are looking at is most likely due to chance and not a reliable trading strategy to implement in the future. Before accepting any investment truism, it is important to be sufficiently skeptical before implementing it yourself.
Returns from Fama/French CRSP Data Library.


