Long View Summer Reads
Signal vs. Noise: Great Companies Don’t Always Make for Great Investments. The Evidence Around IPOs.
Beyond the Number
A Book That Changed How I Think About Aging
What Happens When the Noise Gets Quiet
Category: Planning
Signal vs. Noise: What State Pension Funds Can Teach Investors About Chasing Performance

State pension funds are often viewed as the “smart money” of the investment world.
They employ large internal investment staffs. They hire teams of consultants. They have access to private investments unavailable to most investors. They negotiate lower fees because of their enormous scale. They conduct deep due diligence on hedge funds, private equity managers, venture capital firms, and real estate partnerships.
In theory, if anyone should outperform a simple index portfolio, it should be them.
Yet the evidence tells a very different story.
A well-known paper by Jeffrey Hooke and John Walters, “Wall Street Fees and Investment Returns for 33 State Pension Funds,” examined the results of large public pension systems and compared them to low-cost passive benchmarks. The conclusion was striking: the median pension fund underperformed a basic indexed portfolio by roughly 1.6% annually over the study period.
That gap may not sound large at first glance, but compounded over decades, it becomes enormous.
More Complexity Did Not Lead to Better Results
Over the past two decades, many pension funds have dramatically increased their exposure to:
- Private equity
- Hedge funds
- Venture capital
- Tactical asset allocation
- Alternative credit
- Real assets
- “Opportunistic” strategies
These investments are often marketed as sophisticated tools capable of delivering higher returns, downside protection, or diversification benefits unavailable in public markets.
But despite all of the resources available to these institutions, the end results frequently disappointed.
Importantly, many of these pension portfolios were also taking more risk than a traditional 60/40 stock and bond portfolio. They often had:
- Higher equity exposure
- Significant leverage embedded in private investments
- Illiquid assets
- Increased credit risk
- More aggressive return assumptions
In other words, many pensions were not underperforming because they were conservative. They were underperforming despite taking greater risks and paying substantially higher fees.
The Cost of Chasing “What’s Next”
One of the most persistent themes in investing is the belief that there must always be a better answer somewhere else:
- A smarter manager
- A new asset class
- A more complicated strategy
- A niche product that can unlock hidden returns
But investing evidence has consistently shown that expected returns are driven primarily by exposure to compensated risks, not complexity.
Chasing fashionable investments or attempting to time markets often introduces:
- Higher fees
- Greater taxes
- More operational friction
- Behavioral mistakes
- Lower transparency
- Increased implementation challenges
And those costs compound quietly over time.
The pension fund experience is a powerful reminder that access alone does not create better outcomes.
Simplicity Is Often an Advantage
At Hill Investment Group, we believe investors are generally better served by focusing on:
- Broad diversification
- Evidence-based sources of expected return
- Low costs
- Tax efficiency
- Disciplined implementation
- Long-term behavior
This does not mean investors should avoid innovation or thoughtful portfolio design. But complexity should have a very high burden of proof.
The reality is that many of the world’s largest and most sophisticated institutions have struggled to outperform simple, low-cost indexed approaches, despite having every conceivable advantage.
For most investors, the lesson is not that investing is easy. It is that successful investing often requires resisting the constant pressure to make it unnecessarily complicated.
Upcoming Webinar: Am I Actually Okay?
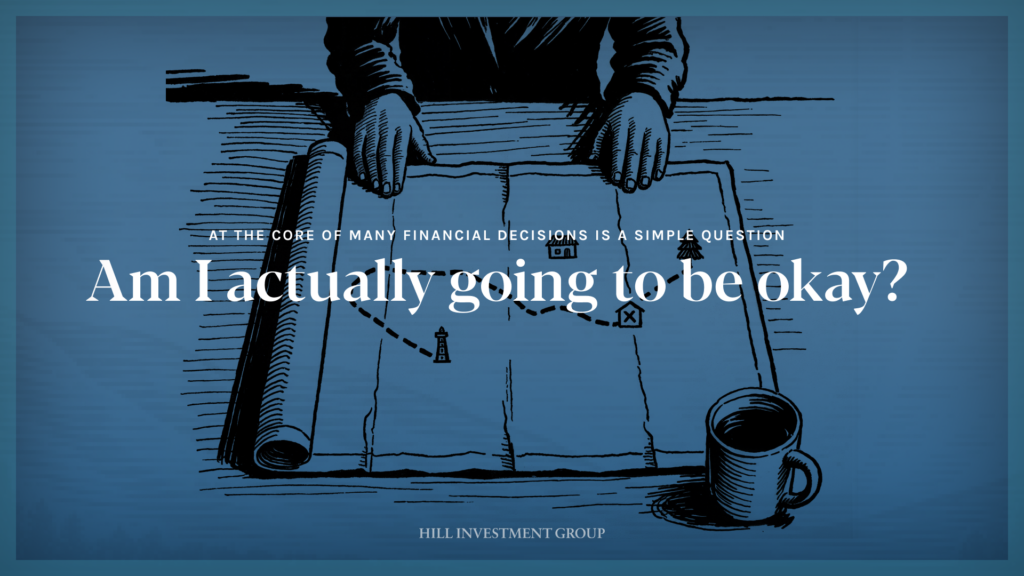
At some point, most people ask themselves if they’re actually okay financially. Not just in a down market, but on a random Thursday.
In reality, this questioning is normal behavior. However, there are some mental strategies available to deal with this that may be incredibly helpful in transforming not just knowing you’re okay from a rational perspective, but genuinely feeling and believing it.
We invite you to join us on May 14, 2026, at Noon CDT, for a live Zoom webinar with Marilyn Wechter, one of the country’s leading financial therapists and wealth counselors, about a framework for knowing where you stand despite the uncertainty going on in life and the world.
This is just another way to help our clients Take the Long View.
Please join us, reserve your spot here.
Don’t Hire Us Because You Like Us

Don’t Hire Us Because You Like Us
There’s something worth saying out loud.
You shouldn’t work with us just because you like us.
When we meet someone new, I often ask how they chose the person they’re currently working with.
The answers are usually some version of:
“He’s a neighbor.”
“She’s a friend of the family.”
“We met through our kids’ sports.”
All perfectly understandable.
But those aren’t the answers I’m hoping to hear.
It would be refreshing to hear someone say:
“Our values really align.”
“I believe in their investment approach.”
“They’ve given us planning advice that has actually changed our financial lives.”
Because when something as important as your financial life is involved, that’s what should matter.
Likability is certainly a factor. We enjoy it as much as anyone. It makes relationships easier. It makes conversations more natural. And it tends to persist for years.
But it’s not a sufficient reason to choose someone to manage your life savings.
That’s where we’re different.
You should work with us because we believe in something.
Because our approach is grounded in decades of academic research, not opinion or prediction.
Because we’ve built real strategies, like the work behind EBI and LVIG, that are designed with intention, not assembled to match a trend.
Because we care deeply about financial planning. Not just portfolios, but the decisions that actually shape your life.
And because we are fiduciaries. We work for our clients. Not a brokerage firm. Not a bank. Just you.
In short, if you believe what we believe, that’s the foundation for a long and healthy relationship.
If you like us too, that’s even better. It makes the relationship more enjoyable. It makes conversations easier. It probably makes the whole experience better.
But it’s a bonus. The icing on the cake.
Because over time, we’ve found that the best outcomes don’t come from chasing what feels right in the moment. They come from committing to a sound approach and sticking with it. Taking the long view.
Performance, in that sense, isn’t the goal. It’s the result.
The best outcomes we’ve seen come from staying put when it was hardest to do so.
That doesn’t always win the popularity contest.
But in the long run, what matters isn’t who you like the most.
It’s who you can rely on when it counts.
So you can invest your money and your time in the people you actually like.
Take the long view,
