Details Are Part of Our Difference
Embracing the Evidence at Anheuser-Busch – Mid 1980s
529 Best Practices
David Booth on How to Choose an Advisor
The One Minute Audio Clip You Need to Hear
Category: Advanced
SECURE Act 2.0 and What it Means for You

As most of us were celebrating the holiday season, a significant piece of legislation passed that, in one way or another, impacted every person reading this. We’ve tried to boil down the 100+ pages to these highlights:
Required Minimum Distributions: The age at which required minimum distributions (RMDs) begin was pushed back to age 73 for individuals born between 1951-1959 and age 75 for those born after 1960, allowing for additional tax deferrals for many.
529 Plan Changes: Beginning in 2024, some individuals can move money from a 529 plan directly to a Roth IRA. This can be incredibly impactful if you set up a 529 years ago and the beneficiary finished college (or didn’t attend college) without completely exhausting the funds.
Retirement Plan Changes: Beginning in 2025, catch-up contributions will be indexed to inflation, ultimately allowing for more significant retirement vehicle savings. Additionally, matching contributions from employers can now be made to Roth accounts.
Student Loan Debt: Starting in 2024, employers can “match” employee student loan payments by contributing to a retirement account for the employee.
Please get in touch with us if you’d like to discuss any of the above information and see how it may impact your specific situation.
Hill Investment Group is a registered investment adviser. Registration of an Investment Advisor does not imply any level of skill or training. This information is educational and does not intend to make an offer for the sale of any specific securities, investments, or strategies. Investments involve risk and, past performance is not indicative of future performance. Consult with a qualified financial adviser before implementing any investment strategy.
The Lure of Private Equity

One of the most memorable fairytales of my childhood was the story of Hansel and Gretel. In this tale, an evil witch lures two children to her house made of gingerbread with the promise of candy and sweets, only to try and eat the unsuspecting kids. This story was namely memorable due to the nightmares that it caused me, but I never forgot the lesson that if something sounds too good to be true, it probably is. Investing in Private Equity (PE) reminds me of this story. Private Equity managers lure investors in with the promise of exclusive access to uncorrelated returns and higher performance reserved only for the ultra-rich. One only needs to dive a little deeper to realize that many of these claims aren’t what they appear to be. Lack of pricing, misleading return numbers, high fees, and illiquidity make this asset class less than desirable.
 |
Lack of Price Transparency | PE investments are only priced once a quarter. These prices do not come from actual trades between willing market participants, but rather from PE managers claiming what they think they could sell a business for. Only posting prices once a quarter, and not having transparency on where those prices came from, makes the returns of PE appear smoother and less risky than they truly are. |
 |
Internal Rate of Return (IRR) | PE managers often advertise their stellar returns via IRR numbers. For example, firms like Apollo and KKR have since inception IRR returns of 25-35% a year! Who wouldn’t want to invest in a firm that has returned 30% a year for decades? Unfortunately, this IRR number is not comparable to the time-weighted returns you see from public markets. Early success on low asset values can skew the IRR number to look higher than the return most investors experienced. Based on the amount of assets Apollo and KKR have managed over the last few decades they would have 2.5x more assets than they currently do if they had 30% year-over-year returns since inception (not including any additional inflows from new clients). Using more comparable return calculations you find that PE returns are very similar to those of public markets. |
 |
High Fees | All-in, PE fees are ~6-7%/year. This is made up of mostly a management fee and a performance fee. Management fees are usually around 2%, but some of the more successful managers charge even more. Performance fees are usually around 20%, charged on top of the ~2% management fee. As a point of comparison, the public equity funds we use in our models today charge between 0.17-0.39% management fees (8x cheaper), and no performance fees. Ultimately the economic rents of skilled PE managers accrue to the managers themselves, not the investors. PE is often referred to as the “Billionaire Factory” – for managers, not investors. From 2005 to 2020, 19 new billionaires came out of Private Equity alone. |
 |
Illiquidity | PE also has the nasty feature of illiquidity. Once you decide to invest, your money might be tied up for 5-10 years, meaning you can’t get it out if you need it. This lack of flexibility is a large drawback to this style of investing. You may be willing to make this sacrifice for the prospect of higher returns. But as already discussed, because of the high fees there is little evidence that PE can reliably provide higher returns. |
This information is educational and does not intend to make an offer for the sale of any specific securities, investments, or strategies. Investments involve risk and, past performance is not indicative of future performance. Consult with a qualified financial adviser before implementing any investment strategy.
Broken Clocks are Right Twice a Day

Does anyone know when to get in and out of the market? Many professionals try, and we’ve heard a few theories from amateur investors lately. It’s tricky to tell fact from fiction. There are a million ways to analyze historical data to find timing patterns that appear to produce attractive returns. The real question you need to ask yourself: “Is there any reason why I should expect that pattern to continue in the future, or is it purely due to chance?”
An example. Over the last thirty years, if you sorted stocks based on the letter of the alphabet they started with, you would see that stocks that began with the letter “M” outperformed those that started with the letter “E.” Is there any reason to suspect this to continue over the next 30 years?
No, clearly, the letter of the alphabet should have no impact on a company’s returns. The reason for this difference is that Microsoft was a large, successful company over this period, while Enron was a large, unsuccessful company over this period.
When working with “noisy” data, the odds that the results are evenly distributed is very small. If you roll a die six times, the odds of getting each number exactly once is tiny (1.5%). That means there is a 98.5% chance you will roll some number two or more times and some number zero times.
A typical market timing strategy we hear about around this time of year is to “avoid investing in the month of September.” At first thought, it seems odd that September would produce below-average returns, but when you look at the historical data, it is true!
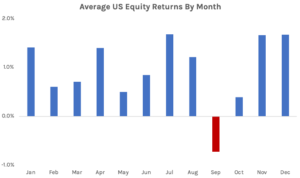
Is there any economic rationale as to why this should continue in the future? I can’t think of any. Some claim that it is due to market participants selling positions to clean up their books after taking time off in the summer. If that were true, why wouldn’t investors try and get ahead of it and sell in August? Or why wouldn’t hedge funds gobble up all the low-priced stocks and keep prices stable?
Let’s dive deeper into the data and look at the five largest market declines over the last 100 years. Each drop produced several months of negative returns, but all five of them spanned September at some point.
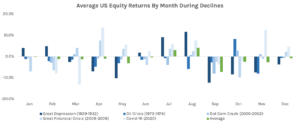
The recession peaked in different months every time, and every month was hit negatively at some point. However, there was bound to be one month affected more than others. It just happened to be September. From 1926 to 2021, 52% of the September months had positive returns. The large negative returns from a few market downturns have skewed the average to be negative. The question is, do we expect this to continue in the future?
Whenever you hear of these market timing strategies, you need to ask yourself if there is a logical economic rationale as to why the trend existed in the past and why it should continue in the future. Is there some risk associated with September we don’t know about? Is there some behavioral rationale that investors can’t arbitrage away? If you can’t come up with a concrete reason, whatever anomaly you are looking at is most likely due to chance and not a reliable trading strategy to implement in the future. Before accepting any investment truism, it is important to be sufficiently skeptical before implementing it yourself.
Returns from Fama/French CRSP Data Library.