Details Are Part of Our Difference
Embracing the Evidence at Anheuser-Busch – Mid 1980s
529 Best Practices
David Booth on How to Choose an Advisor
The One Minute Audio Clip You Need to Hear
Tag: market volatility
Play this Game
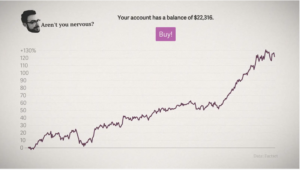
Timing the market can take on many different forms, but we’ve all done it at some point in our lives, even me. Sometimes the market is at an all-time high and we feel there is no way it can keep going up for much longer. We decide to wait for that market correction before investing. Sometimes there is turmoil in the world, markets are falling, and we want to wait to invest until that volatility subsides. In the moment, it always seems to feel obvious what the correct “market timing” strategy is.
Unfortunately, in the real world, timing the market is extremely difficult to do. As a firm of investment professionals, we recently tried to artificially time the market during a team Zoom…and we failed miserably. We used the website: Try to Time the Market to test ourselves. The website simulates a random 10-year historical return sequence from the US stock market. Over those ten years, you get one chance to sell and go to cash, and one chance to buy back into the market. You will beat the market return if you pick the right time to get out and get back in. Sounds easy, just sell when the market is at a high, and buy when it’s at a low.
As a firm, we only outperformed the market 40% of the time. Meaning 60% of the time, we would have been better off if we had just stayed invested the entire 10-year period. To make matters worse, when we did beat the market, it was only by a few percentage points, but when we lost to the market, it was usually by 50+%.
The game only takes a minute to play. Give it a few tries, and see how you fair. We’d love to hear how you did.
Why did we fail at trying to time the market? On average, the market goes up a few hundredths of a percent every day. This means that each day your money is out of the market you are losing out on that potential gain. If the market actually went up a tiny bit every day, no one would ever think to try and time it. However, the volatility of the market makes trying to time it so enticing. If you just avoid some of those bad days, months, or years, it can make a drastic difference in your net wealth. The trouble is if you miss out on those great days, months, or years, it can also make a drastic difference in your net wealth. Given, on average, that the market goes up every day, you are better off not trying to play the timing game and simply stay invested.
You’re better off taking the long view.
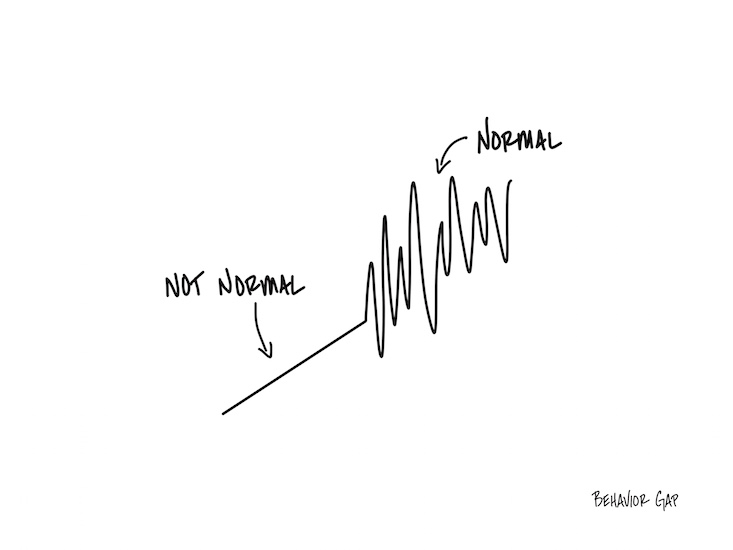
Normal Volatility
Imagine it’s a very still day, and you’re in a boat on the ocean.
There’s no wind.
No swell.
The water is as flat as a mirror.
The calm goes on just long enough for you to start to feel like it’s normal.
When a small wave finally comes… it feels big. When a regular wave comes… it feels huge.
As scary as it might feel, it’s important to remember that waves are normal.
In fact, occasional storms are normal.
And the last thing you want to do when you get into a storm is abandon ship.
Recent Market Volatility
As of May 17th, the S&P 500 is down 14% year to date. Given the apparent negative economic outlook, many investors are concerned about their investments and what they should do. However, before descending down a worry spiral, pause and ask yourself: “Is this normal? Have I seen this before?”
During the 94 calendar years from 1928 to 2021, the US stock market had intra-year, double-digit declines 59 times. That’s almost two of every three years that the US Market experiences a double-digit decline. Yes, two-thirds of the time. So, we can conclude that a drop like the one we are currently seeing is a common event in the stock market. Not only common but good! Why? The reason investors are compensated with positive returns over time from investing in stocks, instead of cash or bonds, is because of the occasional period of negative returns. If there was no risk, investors would not get any reward for bearing that risk. Said differently, market downturns are features, not bugs.
Let’s dive deeper into those 59 years that had double-digit declines. Did the market recover or stay negative at the end of those years? In 58% of those 59 years, the market ended the year with a positive annual return despite the double-digit drop. 40% of those 59 years finished with a double-digit positive return!
What is the economic intuition behind why markets recover more often than not? Markets do a great job of factoring in both positive and negative news about companies and the economic outlook. Investors only invest in the market at current prices if they expect to earn a positive return. If everyone knew that the market would go down, no one would buy stocks at their current prices. Prices would simply fall until they hit a level that gave an investor a commensurate return for the risk they are willing to take. Today’s market prices reflect the current economic outlook. From here, markets might go up or down, but on average, market returns are expected to be positive over time.
That is precisely why we recommend that our clients stick with their well-thought-out investment plans rather than panic out of the market. The risks you may be worried about are already factored into stock prices. You are not alone in your fears, but that doesn’t mean you have to act on them. By selling now, you will miss out on the future positive expected return of stocks. We just can’t predict when those positive returns will happen.
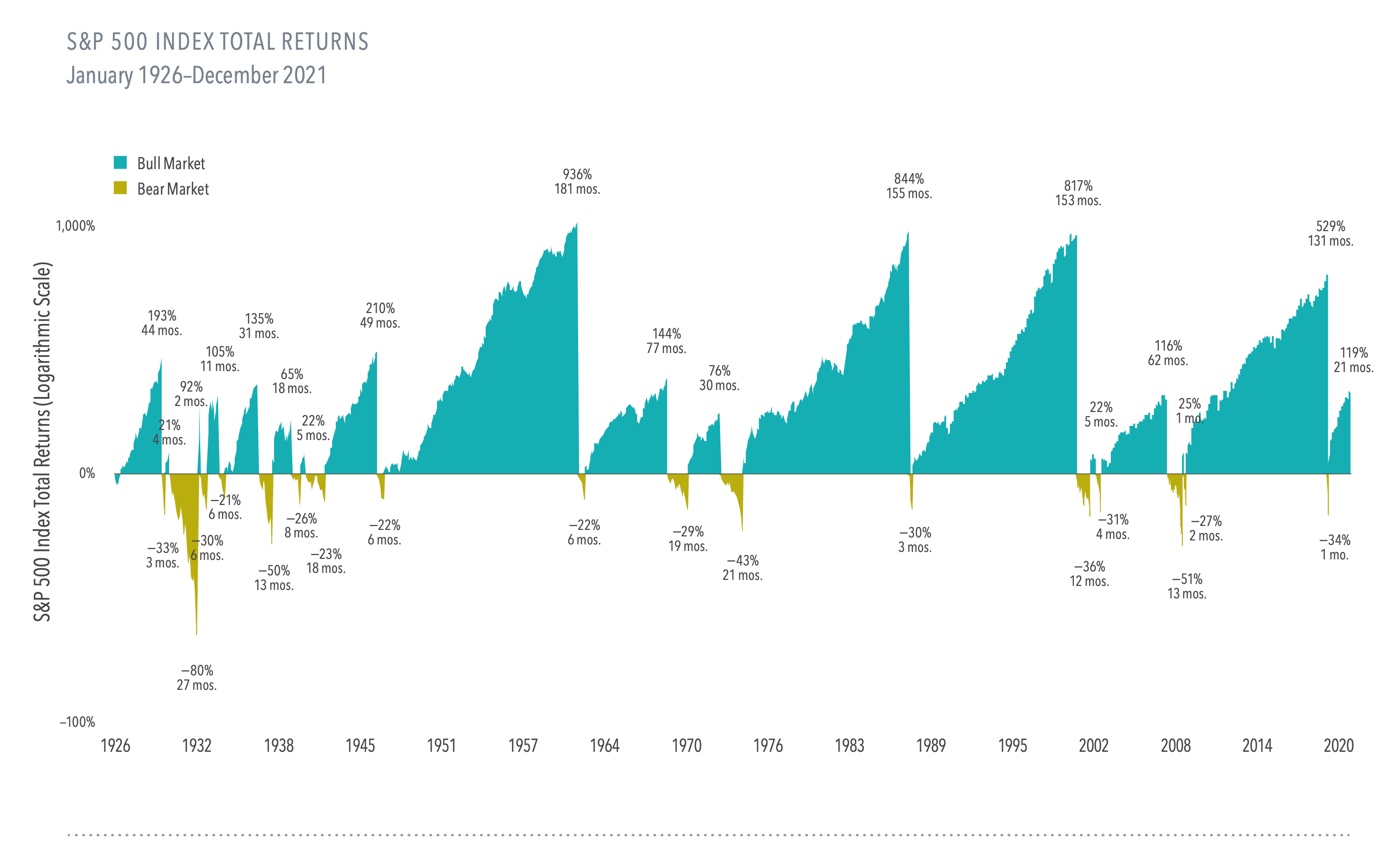
When you look at nearly a century of bull and bear markets, the good times have outshined the bad. While we don’t know how long a bear market will last, staying invested ensures that you capture the bull markets when they do arrive again.