Details Are Part of Our Difference
Embracing the Evidence at Anheuser-Busch – Mid 1980s
529 Best Practices
David Booth on How to Choose an Advisor
The One Minute Audio Clip You Need to Hear
Tag: Matt Zenz
Welcoming Matt Zenz as a New Partner

We are thrilled to announce that our CIO, Matt Zenz, is officially joining our leadership team and becoming a partner. Matt’s extensive experience in our evidence-based approach to investing makes him an invaluable addition to our leadership team.
Matt has an impressive background in systematically managing assets across multiple strategies. His career includes significant roles such as Chief Investment Officer at Hill Investment Group (past 3 years), Product Specialist at Stone Ridge Asset Management, and Portfolio Manager at Dimensional Fund Advisors, where he managed over $80 billion in U.S. small and mid-cap equity assets.
Matt holds an MBA from Harvard Business School, a Master’s in Electrical Engineering from the Ohio State University, and graduated Magna Cum Laude from the University of Notre Dame with a Bachelor’s degree in both Electrical and Mechanical Engineering. His academic accomplishments are bolstered by his practical experience in and deep knowledge of multi-factor investing and asset pricing.
Throughout his career, Matt has been dedicated to engaging with clients, ranging from sophisticated institutional investors to families and individuals. His ability to clearly communicate and implement our research-based approach has been instrumental in building strong client relationships with clients and HIG teammates.
When asked about why Matt loves his work and what it means to him he said “I care about and seek truth in all things – I just happen to love doing that most within investing. Helping clients find that truth about their financial situation brings me great satisfaction.”
Matt will continue to leverage his extensive expertise and leadership skills as a partner to drive our firm’s mission of delivering exceptional evidence-based investment solutions. His addition as partner marks not just a new chapter but a potential turning point for Hill Investment Group as we strive to enhance the quality of our services and help achieve your long-term goals.
Please join us in celebrating Matt Zenz as our third partner!
(Matt Hall and Nell Schiffer are the other firm leaders and owners)
Stay tuned for more updates and insights from Matt and the rest of our team as we strive to excel in serving our clients and the broader financial community!
Broken Clocks are Right Twice a Day

Does anyone know when to get in and out of the market? Many professionals try, and we’ve heard a few theories from amateur investors lately. It’s tricky to tell fact from fiction. There are a million ways to analyze historical data to find timing patterns that appear to produce attractive returns. The real question you need to ask yourself: “Is there any reason why I should expect that pattern to continue in the future, or is it purely due to chance?”
An example. Over the last thirty years, if you sorted stocks based on the letter of the alphabet they started with, you would see that stocks that began with the letter “M” outperformed those that started with the letter “E.” Is there any reason to suspect this to continue over the next 30 years?
No, clearly, the letter of the alphabet should have no impact on a company’s returns. The reason for this difference is that Microsoft was a large, successful company over this period, while Enron was a large, unsuccessful company over this period.
When working with “noisy” data, the odds that the results are evenly distributed is very small. If you roll a die six times, the odds of getting each number exactly once is tiny (1.5%). That means there is a 98.5% chance you will roll some number two or more times and some number zero times.
A typical market timing strategy we hear about around this time of year is to “avoid investing in the month of September.” At first thought, it seems odd that September would produce below-average returns, but when you look at the historical data, it is true!
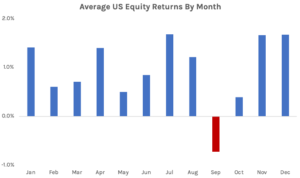
Is there any economic rationale as to why this should continue in the future? I can’t think of any. Some claim that it is due to market participants selling positions to clean up their books after taking time off in the summer. If that were true, why wouldn’t investors try and get ahead of it and sell in August? Or why wouldn’t hedge funds gobble up all the low-priced stocks and keep prices stable?
Let’s dive deeper into the data and look at the five largest market declines over the last 100 years. Each drop produced several months of negative returns, but all five of them spanned September at some point.
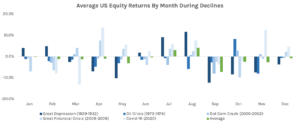
The recession peaked in different months every time, and every month was hit negatively at some point. However, there was bound to be one month affected more than others. It just happened to be September. From 1926 to 2021, 52% of the September months had positive returns. The large negative returns from a few market downturns have skewed the average to be negative. The question is, do we expect this to continue in the future?
Whenever you hear of these market timing strategies, you need to ask yourself if there is a logical economic rationale as to why the trend existed in the past and why it should continue in the future. Is there some risk associated with September we don’t know about? Is there some behavioral rationale that investors can’t arbitrage away? If you can’t come up with a concrete reason, whatever anomaly you are looking at is most likely due to chance and not a reliable trading strategy to implement in the future. Before accepting any investment truism, it is important to be sufficiently skeptical before implementing it yourself.
Returns from Fama/French CRSP Data Library.
Putting the Odds in Your Favor
With all the noisy commentary, complex investment products, and volatile performance in the financial industry, it can be hard to figure out how to act. How can an investor determine which investing strategies have merit and which have outperformed simply by chance?
For our clients, that’s easy! We do it for you. That’s precisely why we’re here, in the service of our clients.
I recently gave a presentation where I reviewed the investment options out there and explained how some investment strategies put the odds of success in one’s favor while others do not. I related this complex topic to a simple game of betting $1,000,000 on the flip of a coin. Heads or tails? After watching this 30-minute presentation, you will have a much better understanding of our motto, “Take the Long View,” and why we are so passionate about our approach to investing.
For anyone that hasn’t already joined our family, click here to set up a time to meet with us if you find this discussion intriguing.
This presentation is for educational purposes only and represents general information regarding Hill Investment Group’s investment advisory service. It does not intend to make an offer or solicitation for the sale or purchase of any specific securities or to provide specific advice. Past performance is not indicative of future performance; investments involve risk and are not guaranteed. Consult with a qualified financial adviser before implementing any strategy.